Raspberry Pi Weather Station

Visualize weather data received from sensors over Radio [github]
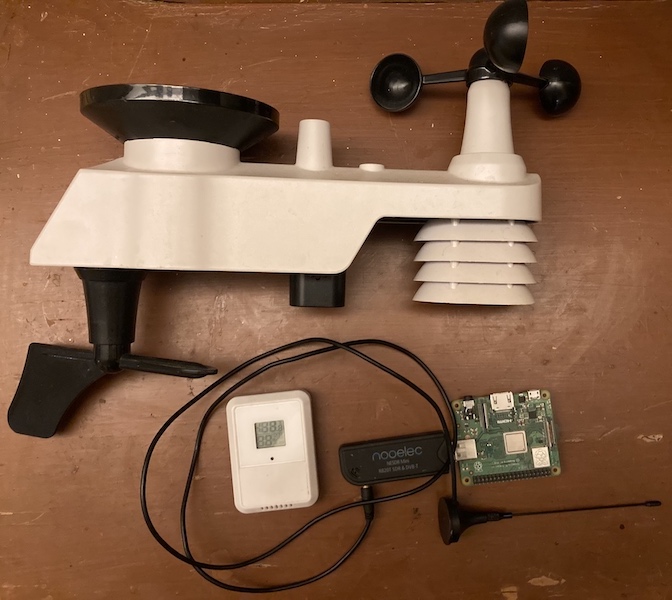
This repository is for recording and visualizing data from a Switchdoc Labs WeatherSense weather station, which includes two sensor units, with Temperature, Humidity, Windspeed, Rainfall, and Sunlight data.
The sensors transmit in the ISM radio band, so a radio receiver attached to a Raspberry Pi logs the data, and it is graphed with a Grafana dashboard. The code in this repository starts 4 services, responsible for:
- Listening for radio transmissions (and deduplicating)
- Logging the received data to an InfluxDB database;
- Running a Grafana dashboard
- Serving with Nginx
This allows you to put the data onto a website accessible on your local network (or potentially the internet, if you want to set up port forwarding).